Visual guide
Find the real cause
Two ways to look past the first answer. Use the 5 Whys when one thing led to another. Use the fishbone diagram when several things played a part.
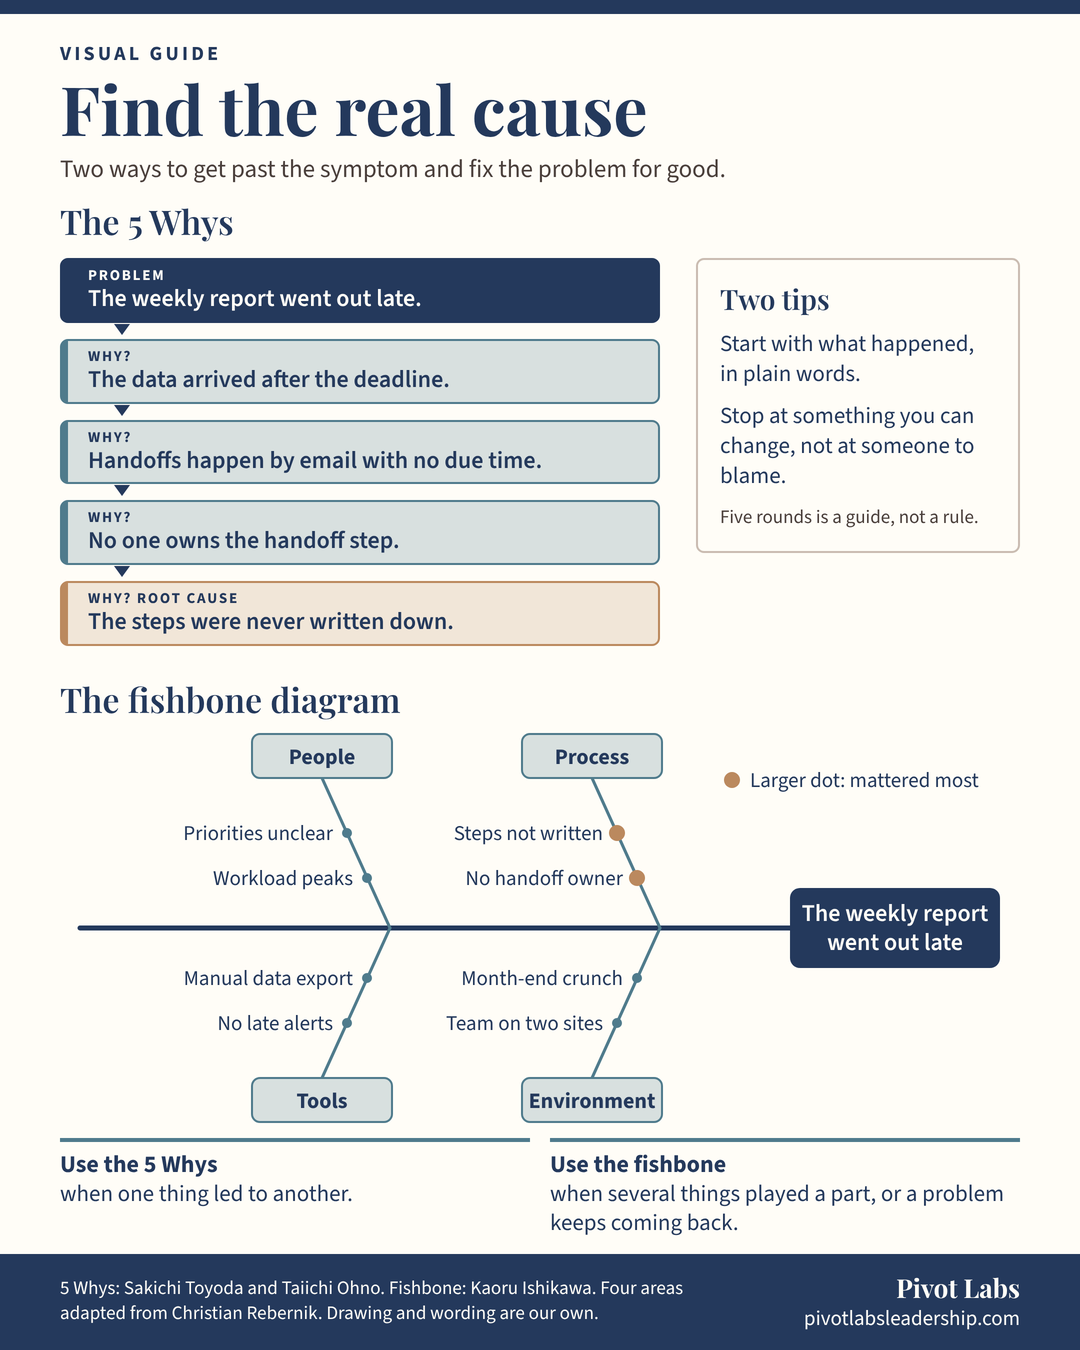
The 5 Whys
Ask why something happened. Then ask why about the answer. Keep going until you reach something you can change. Five rounds is a guide, not a rule.
Example: a late weekly report
- ProblemThe weekly report went out late.
- Why?The data arrived after the deadline.
- Why?Handoffs happen by email with no due time.
- Why?No one owns the handoff step.
- Why?Root causeThe steps were never written down.
Two tips
- Start with what happened, in plain words.
- Stop at something you can change, not at someone to blame.
The fishbone diagram
Write the problem at the head. Then sort what might be behind it into four areas: people, process, tools, and environment. Look for the causes that mattered most, and work on those. People covers skills, training, workload, and communication. It is about the setup, not about blaming anyone.
People
- Workload peaks
- Priorities unclear
Process
- No handoff owner (mattered most)
- Steps not written (mattered most)
Tools
- Manual data export
- No late alerts
Environment
- Month-end crunch
- Team on two sites
Which one to use
The 5 Whys
One thing led to another. You can follow a single chain from the problem back to its cause.
The fishbone diagram
Several things played a part. It is also a good choice when a problem is serious or keeps coming back.
The Root Cause Finder asks a few questions, suggests a method, and ends with a summary you can share with the people working on the fix.
About this guide
This guide is a one-page picture of the two methods in the Root Cause Finder. The 5 Whys comes from Toyota. It was developed by Sakichi Toyoda and made widely known by Taiichi Ohno. The fishbone diagram, also called the cause-and-effect or Ishikawa diagram, was developed by Kaoru Ishikawa, who first used it in 1943. The four fishbone areas are adapted from Christian Rebernik’s Root Cause Analysis infographic. The structure, drawings, and wording here are our own.
Sources: Ishikawa, K. (1976). Guide to quality control. Asian Productivity Organization. · Ohno, T. (1988). Toyota production system: Beyond large-scale production. Productivity Press. · Rebernik, C. (n.d.). Root cause analysis: The leader’s guide to fixing problems for good [Infographic].